ABOUT
First off, let me just say I quickly threw this together for fun. Some behavior is still buggy. I'll try to keep adding weekly data, but may not have time to make other updates. This site is all front end code, so feel free to take it for yourself if you want to improve it. With that unpleasantness out of the way...
This is an interactive chart for exploring Weekly Shonen Jump rankings starting from around 2000. All the data comes from http://pharaodopazo.blogspot.com/p/wsj-rankings.html.
Before you use this, you should have a good understanding of how Weekly Shonen Jump rankings work. This page does a good job of explaining the system. And this is a great English resource for figuring out chapter numbers. Here's some other important notes:
- This data is for fun. It doesn't prove one series is better than another. It's really cool that Assassination Classroom ranked so well, but that doesn't mean it would have similar ranking during the early 2000s. Long trends are more interesting than individual ranks.
- Even when talking about success, sales numbers are probably more important than Jump ranks.
- The time One Piece's ranking went to 6 was because Mr. Oda turned in the manuscript late. He addressed it in his author comments. A really awesome catalog of One Piece comments can be found here
- The displayed issue dates are the Sale Dates
- The chart only lists ranked chapters. If the chapter is unranked (due to color pages or other special events), you'll see a gap in chapter numbers
- The chapter in the info boxes are the ranked chapters (so the chapter from 7 issues ago), NOT the chapter in the current issue
- Chapter Numbers are approximated by a script I wrote. Sometimes they're off by a lot
I tried out amCharts for this project. Here's a quick list of unintuitive functionality when playing with the chart:
- Hover over a column to get more infomation. If the layout looks bad, you can move the cursor off and then try again.
- The left "Series" menu adds series to the right "Selected Series" menu. But you shouldn't use that. Instead, add series via the "Add" search bar on the right side.
- The "Add Series in Range" button will automatically add all the series that have data between the dates you're currently viewing. It won't automatically mark everything as shown
- The "Export" button will create a sharable link of what you are viewing
- Click on a dot to zoom in. Shift+Click a dot to zoom out
- Highlight a range on the chart to zoom in on that range
- Mouse Wheel is not working for scrolling. I don't know why
- Colors are random. If you don't like them, hit the "Export" button to refresh the page
Keep up with updates by following my twitter. Lastly, let me shill some other sites that are important to me. I'd really, really appreciate some visits!

Mochimarks
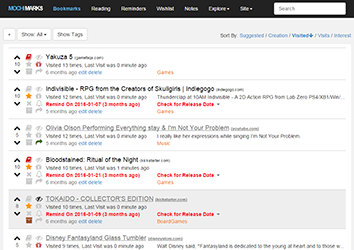
Mochimarks is a bookmarking website focused on helping you regularly use your bookmarks. Features flexible reminders!

Steven Universe Ukulele Chords
A complete Steven Universe vocal songlist, complete with lyrics and chords so you can play along!

Ninja Girl Jun
Should Jun really be calling herself a ninja? Decide for yourself in this fun action-comedy webcomic!
SERIES
I'm going to eventually list all the series with links here.
Selected Series
Add: